
As Bitcoin pushes $100,000 we take a look at the current bitcoin price analysis. For this we are using the TDR and TDV momentum indicators.
Bitcoin – Pushing 100k
On April 23rd, a full buy signal appeared, following two earlier soft buy signals on March 20th and March 24th. As part of my trading strategy, I typically use soft buy signals for small entries—usually allocating less than 5% of my total investment funds for the asset per signal. With the full buy signal on the daily timeframe being about 20%.
In the chart below, I placed these signals and marked the average entry position.
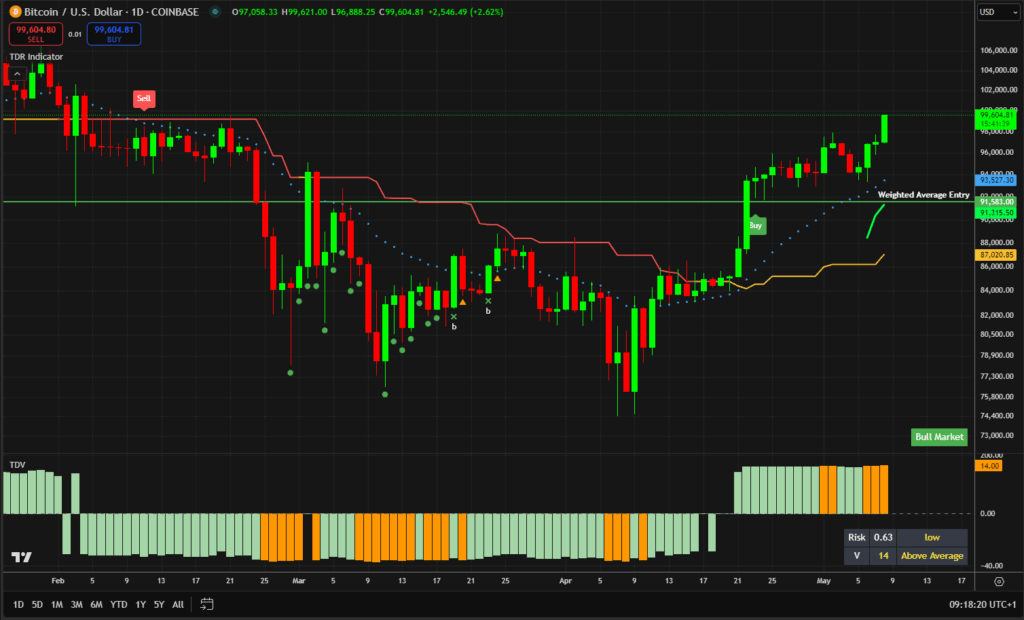
We are currently sitting at an average entry price of $91,583 with 30% of our allocated funds for bitcoin which is just under 9% in profit.
The bigger picture – 3 Day Timeframe
Looking at the bitcoin price analysis on the three day timeframe and where we will allocate the rest of our funds if a buy signal presents itself.
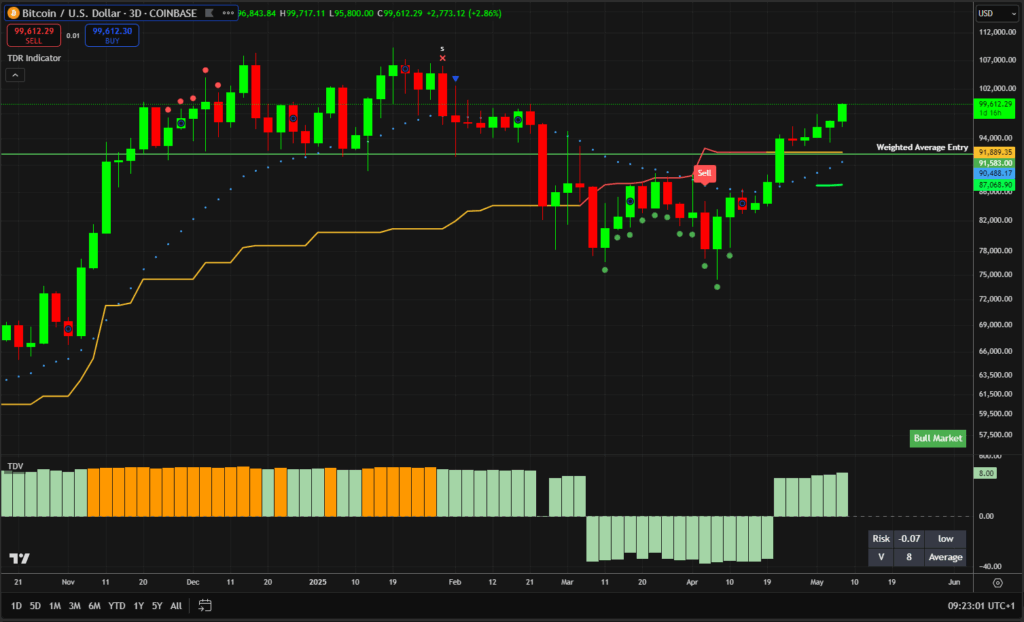
This puts me in a good position to catch the momentum if bitcoin breaks the 100k level.
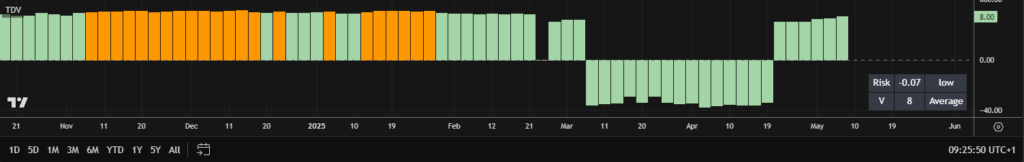
The TDV Indicator
The TDV indicator shows the risk at the price is sitting at a low -0.07 with an Average Volatility of 8. The risk and volatility levels are in a good position to have the early entries in place.
Closing thoughts
Bitcoin is approaching the 100k level again, and I expect a momentum break once it pushes past that price. I have kept funds ready to deploy and continue monitoring the larger three-day timeframe. The daily timeframe is where most of my attention is at the moment. I will be keeping a close eye on the three day timeframe with a view to deploy more funds when ready.
Current Profit on Position – 8.62%
The current profit of our position is sitting a nice an respectable 8.62%